Facts and figures
We are transparent about our research involving laboratory animals, which includes providing access to our annual statistics. On this page, you will find an overview of various aspects, such as the number of animals and the species we use, the types of research for which we employ animals, and the level of discomfort experienced by the animals.
Annual figures on animals experiments for Leiden University in 2022
The infographic below presents an overview of the conducted animal experiments in 2023, specifying the types of laboratory animals used. Click on the magnifying glass to view enlarged images. The complete infographic containing the annual animal testing statistics is also available as pdf.
-
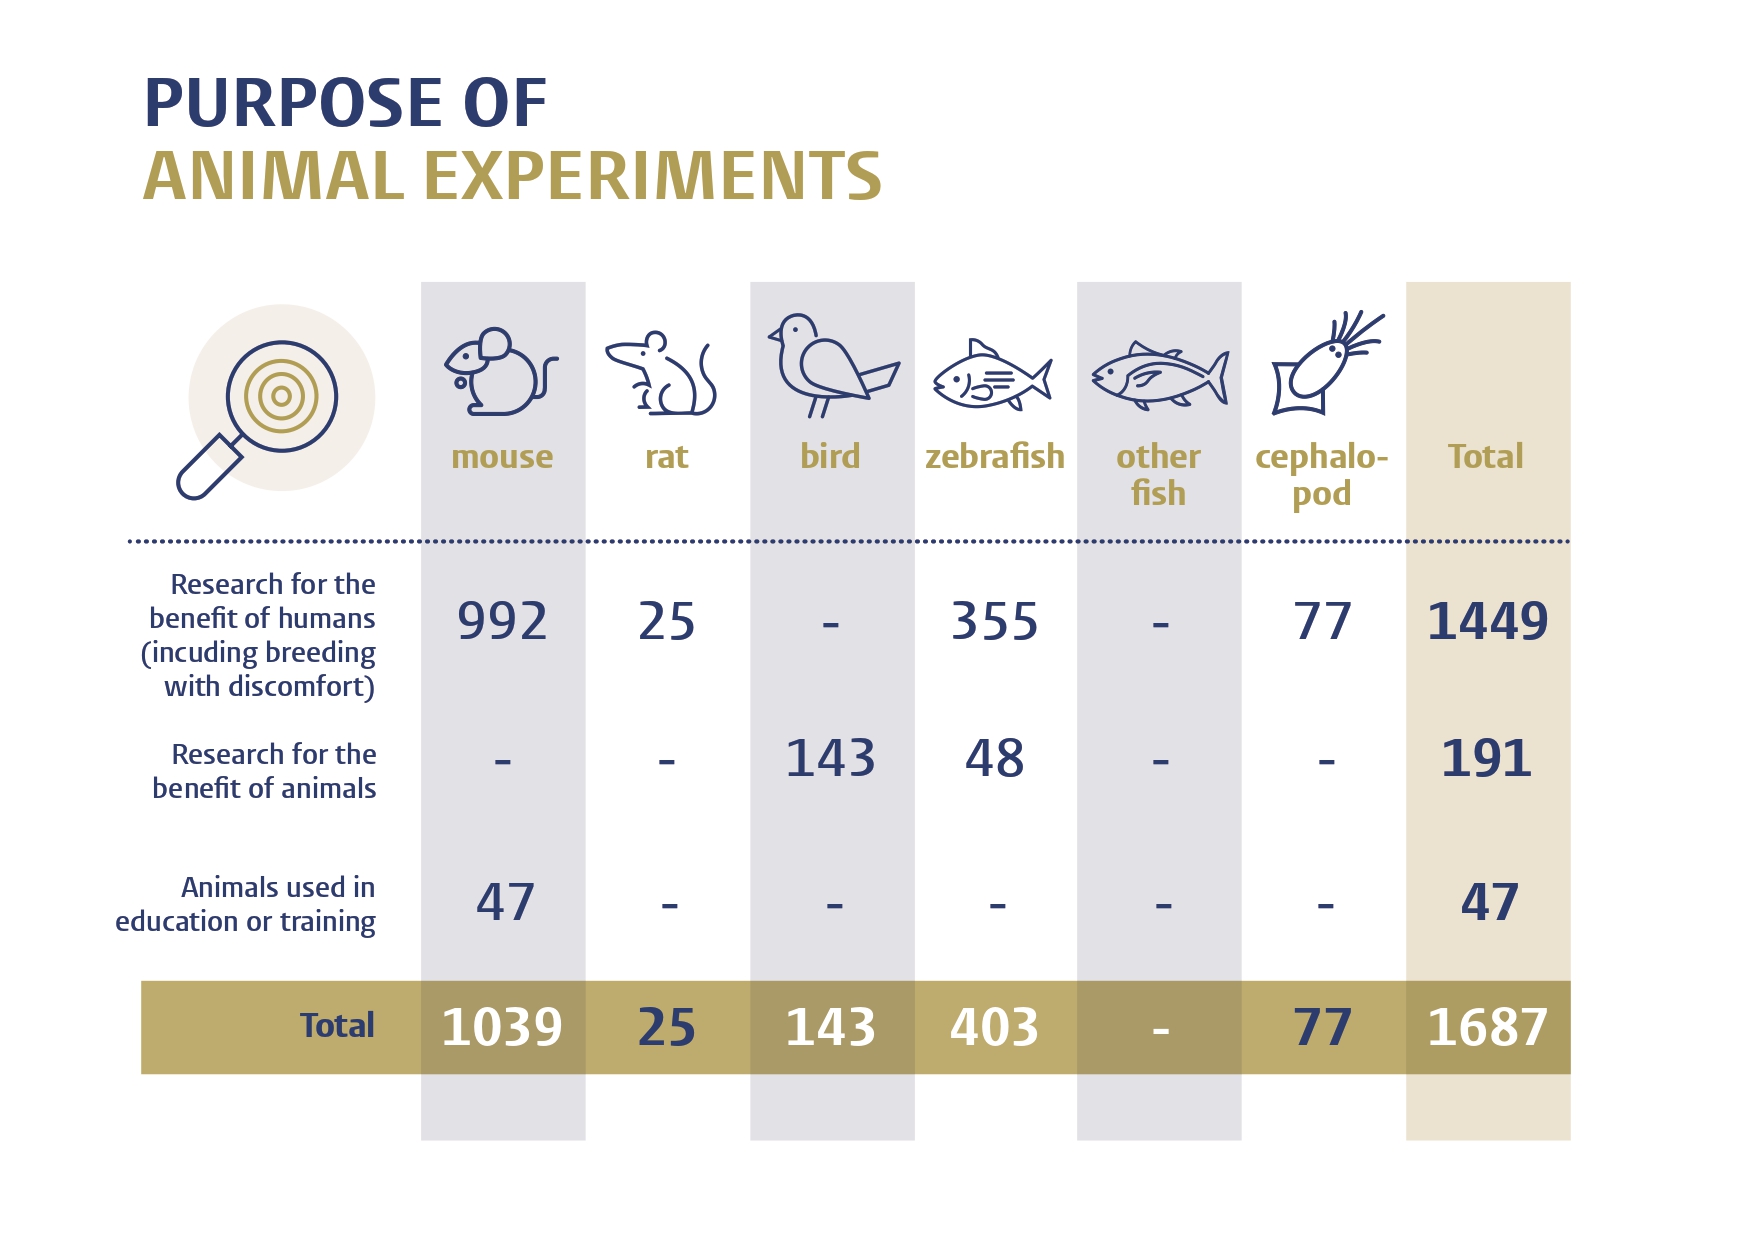
Which animals were used for what purpose in 2023? -
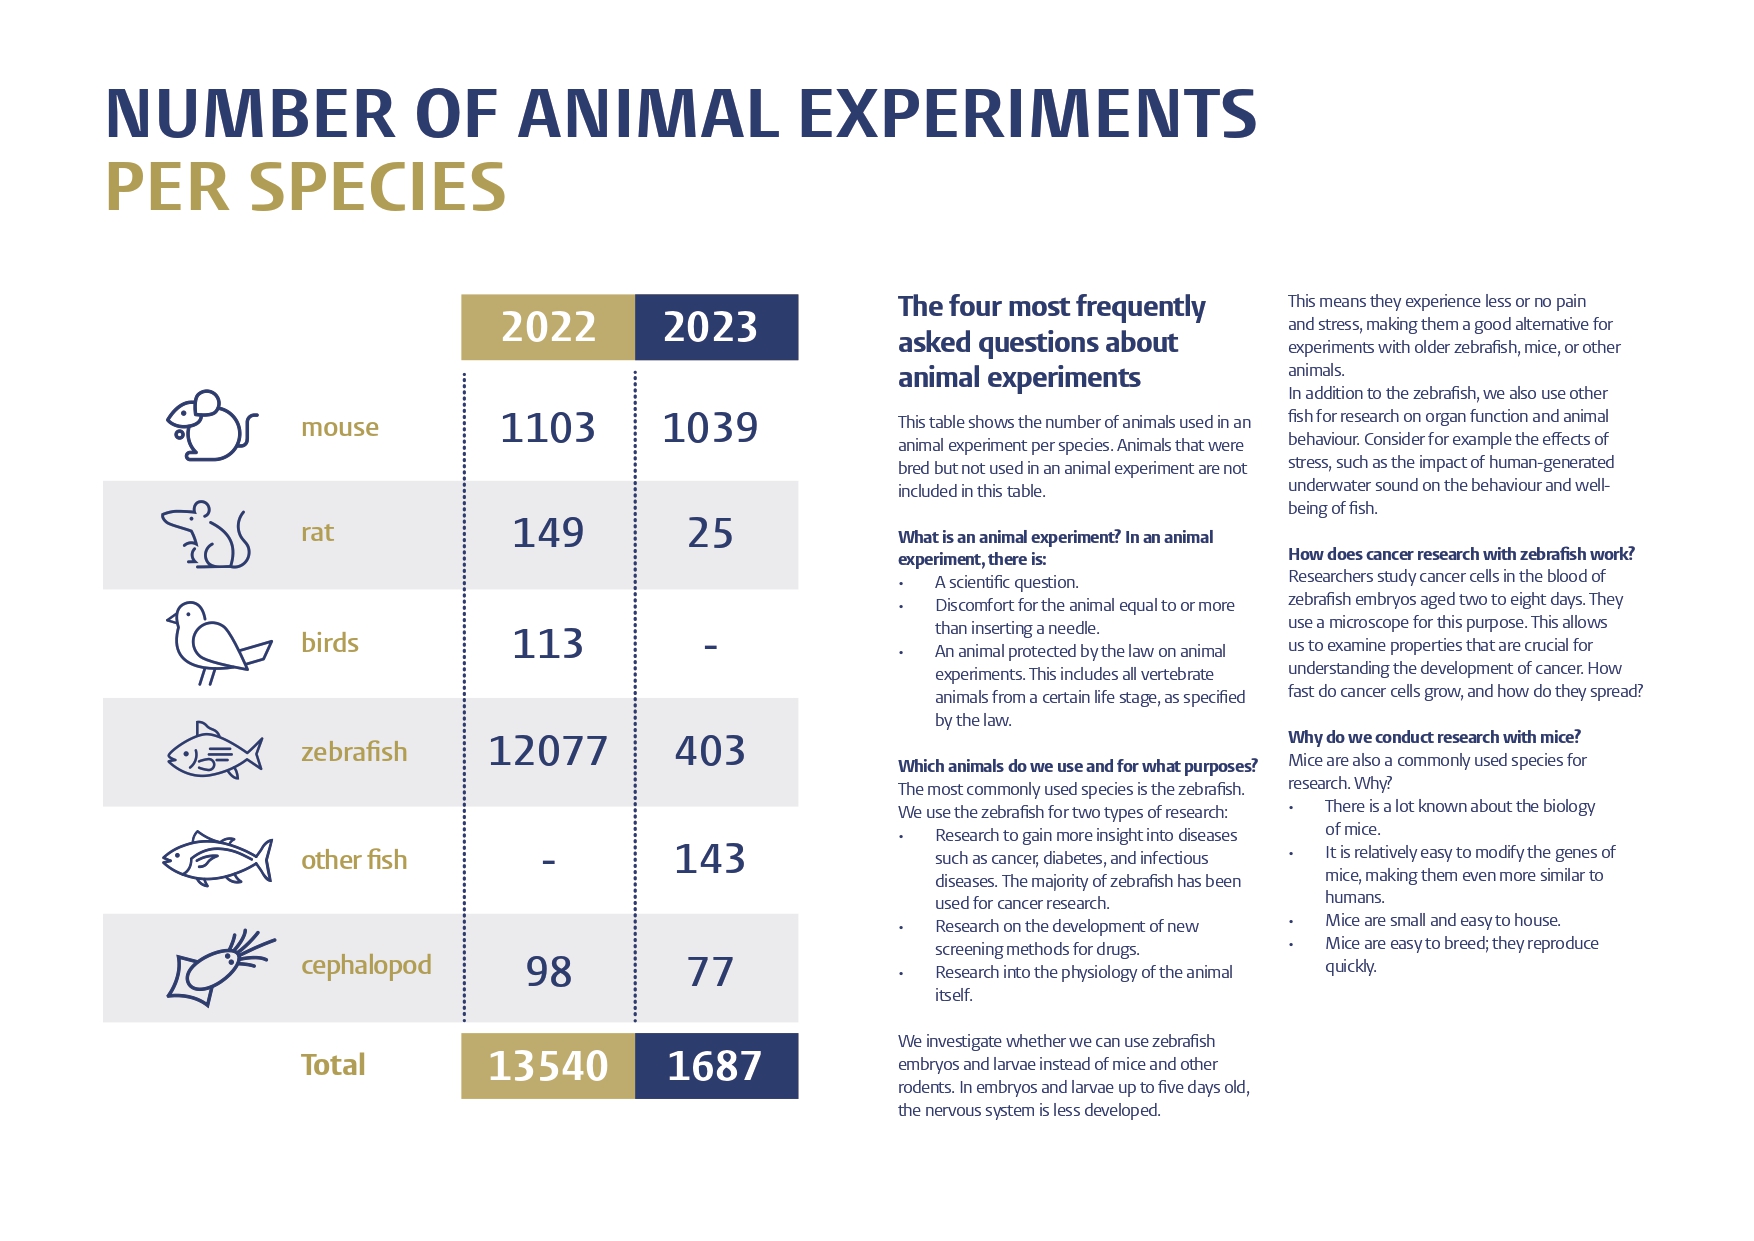
How many of each species have we used in animal experiments? -
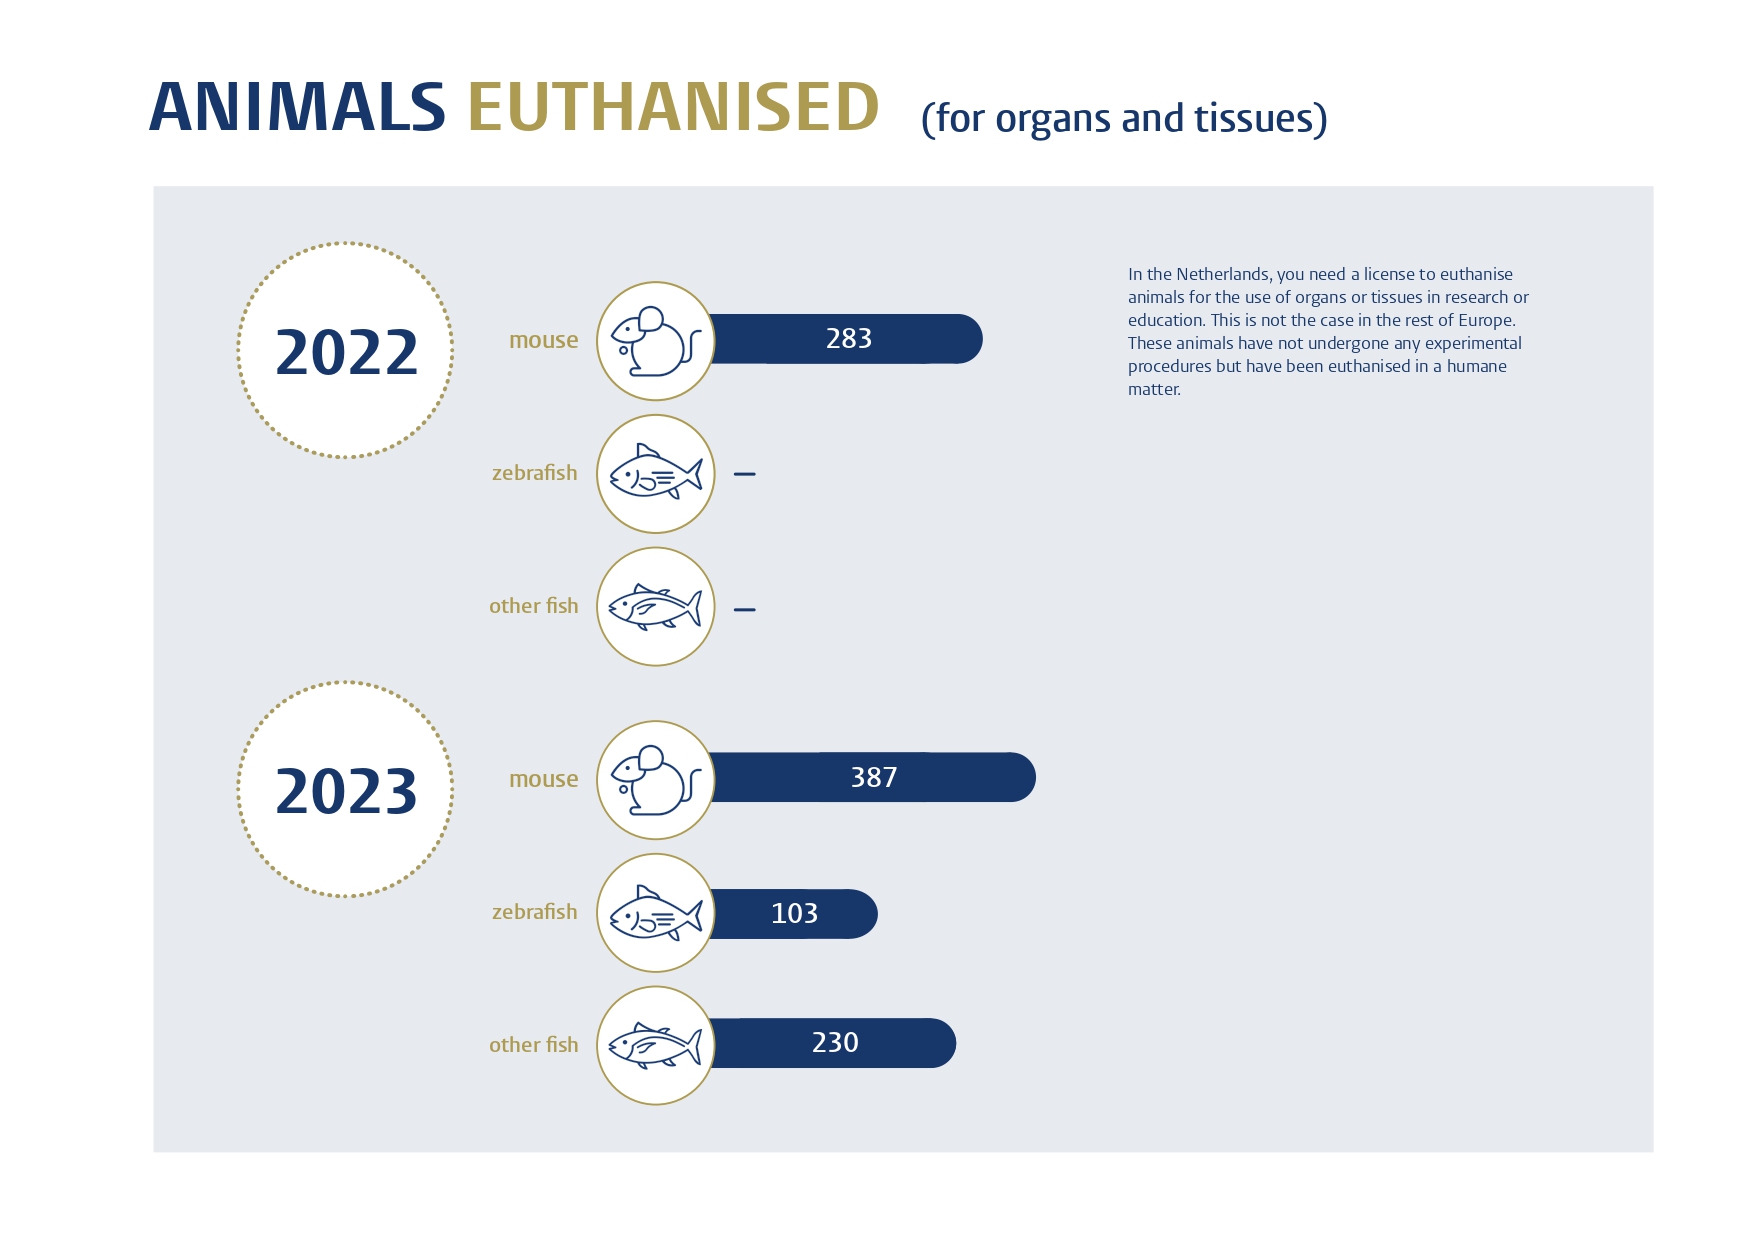
Animals that have been euthanised for the use of their organs or tissues in research or education. These animals have not undergone any experimental procedures but have been humanely euthanised. -
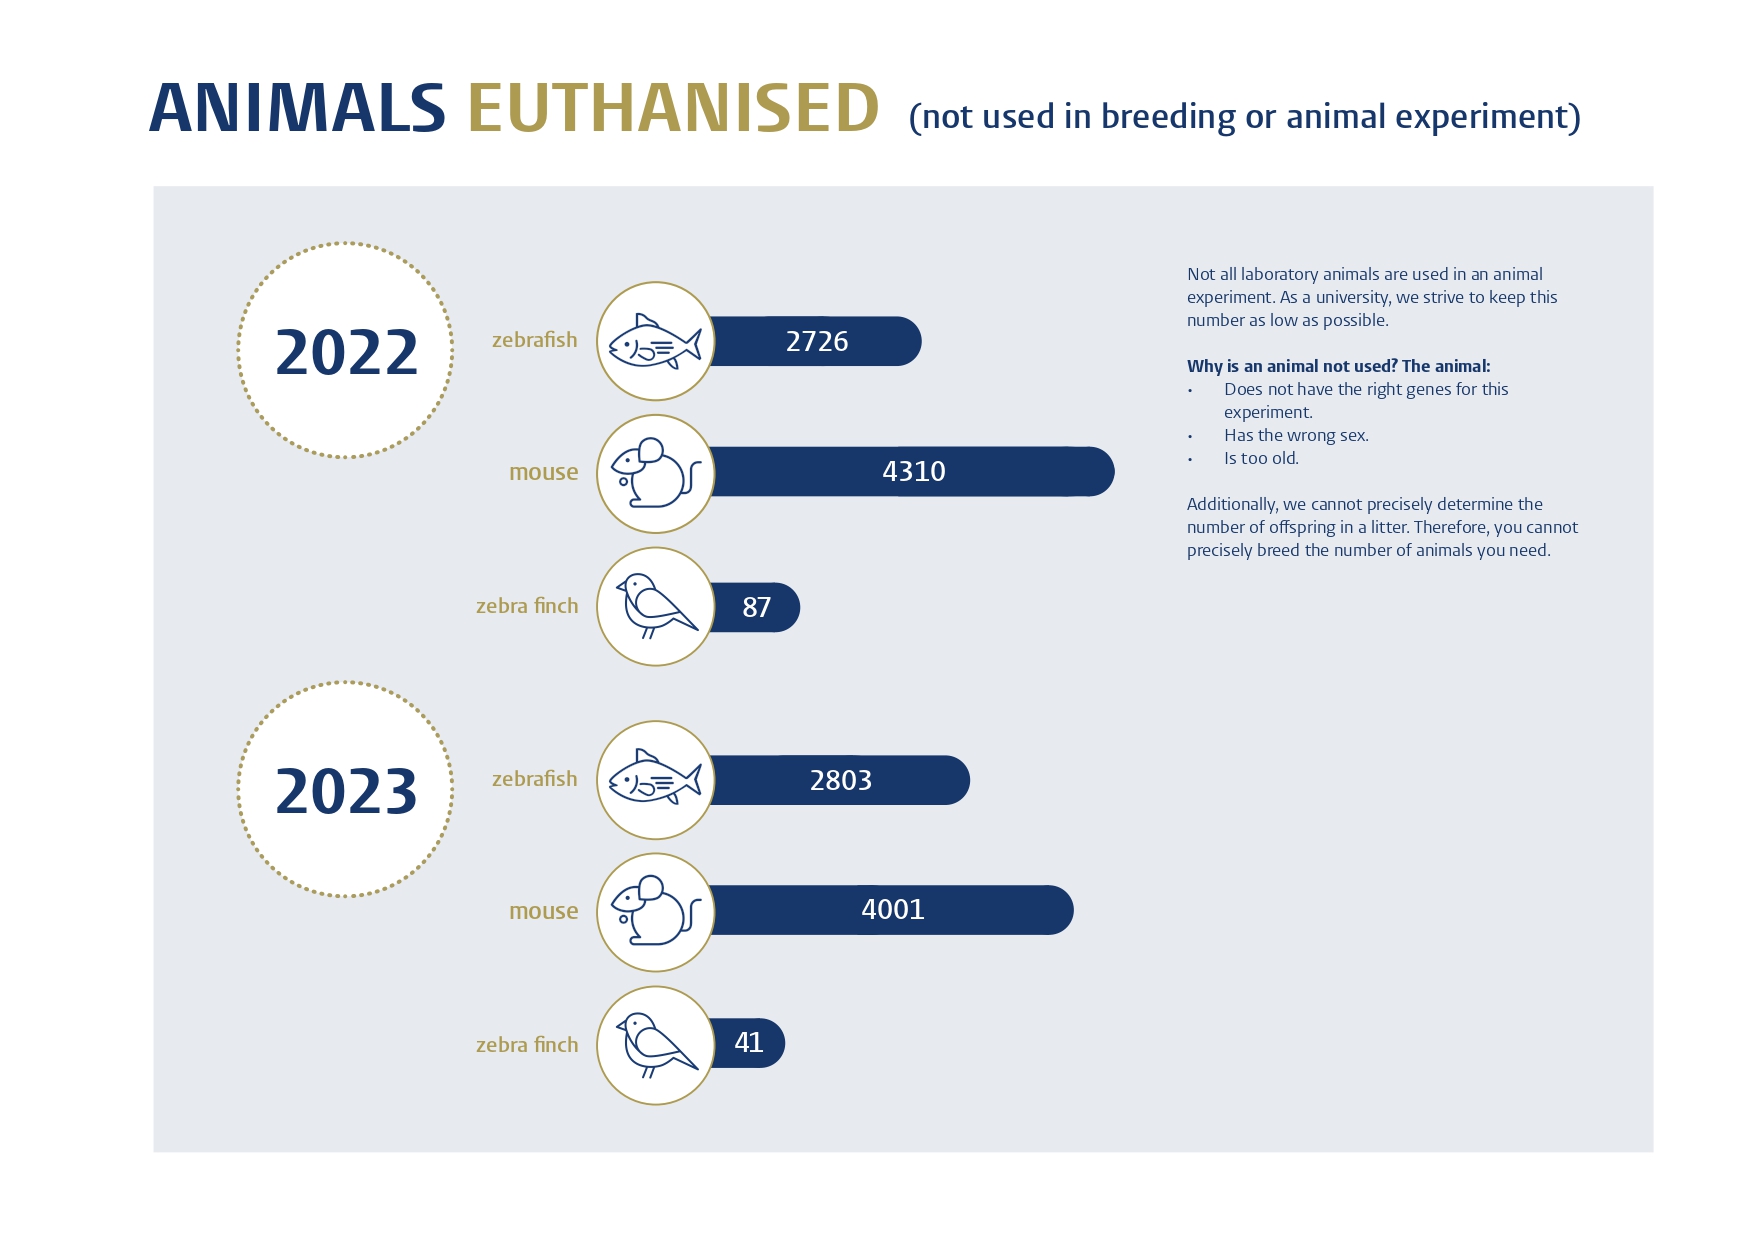
Animals that were born but couldn't be used in an experiment (breeding surplus). These animals were euthanised without having undergone any procedures. -
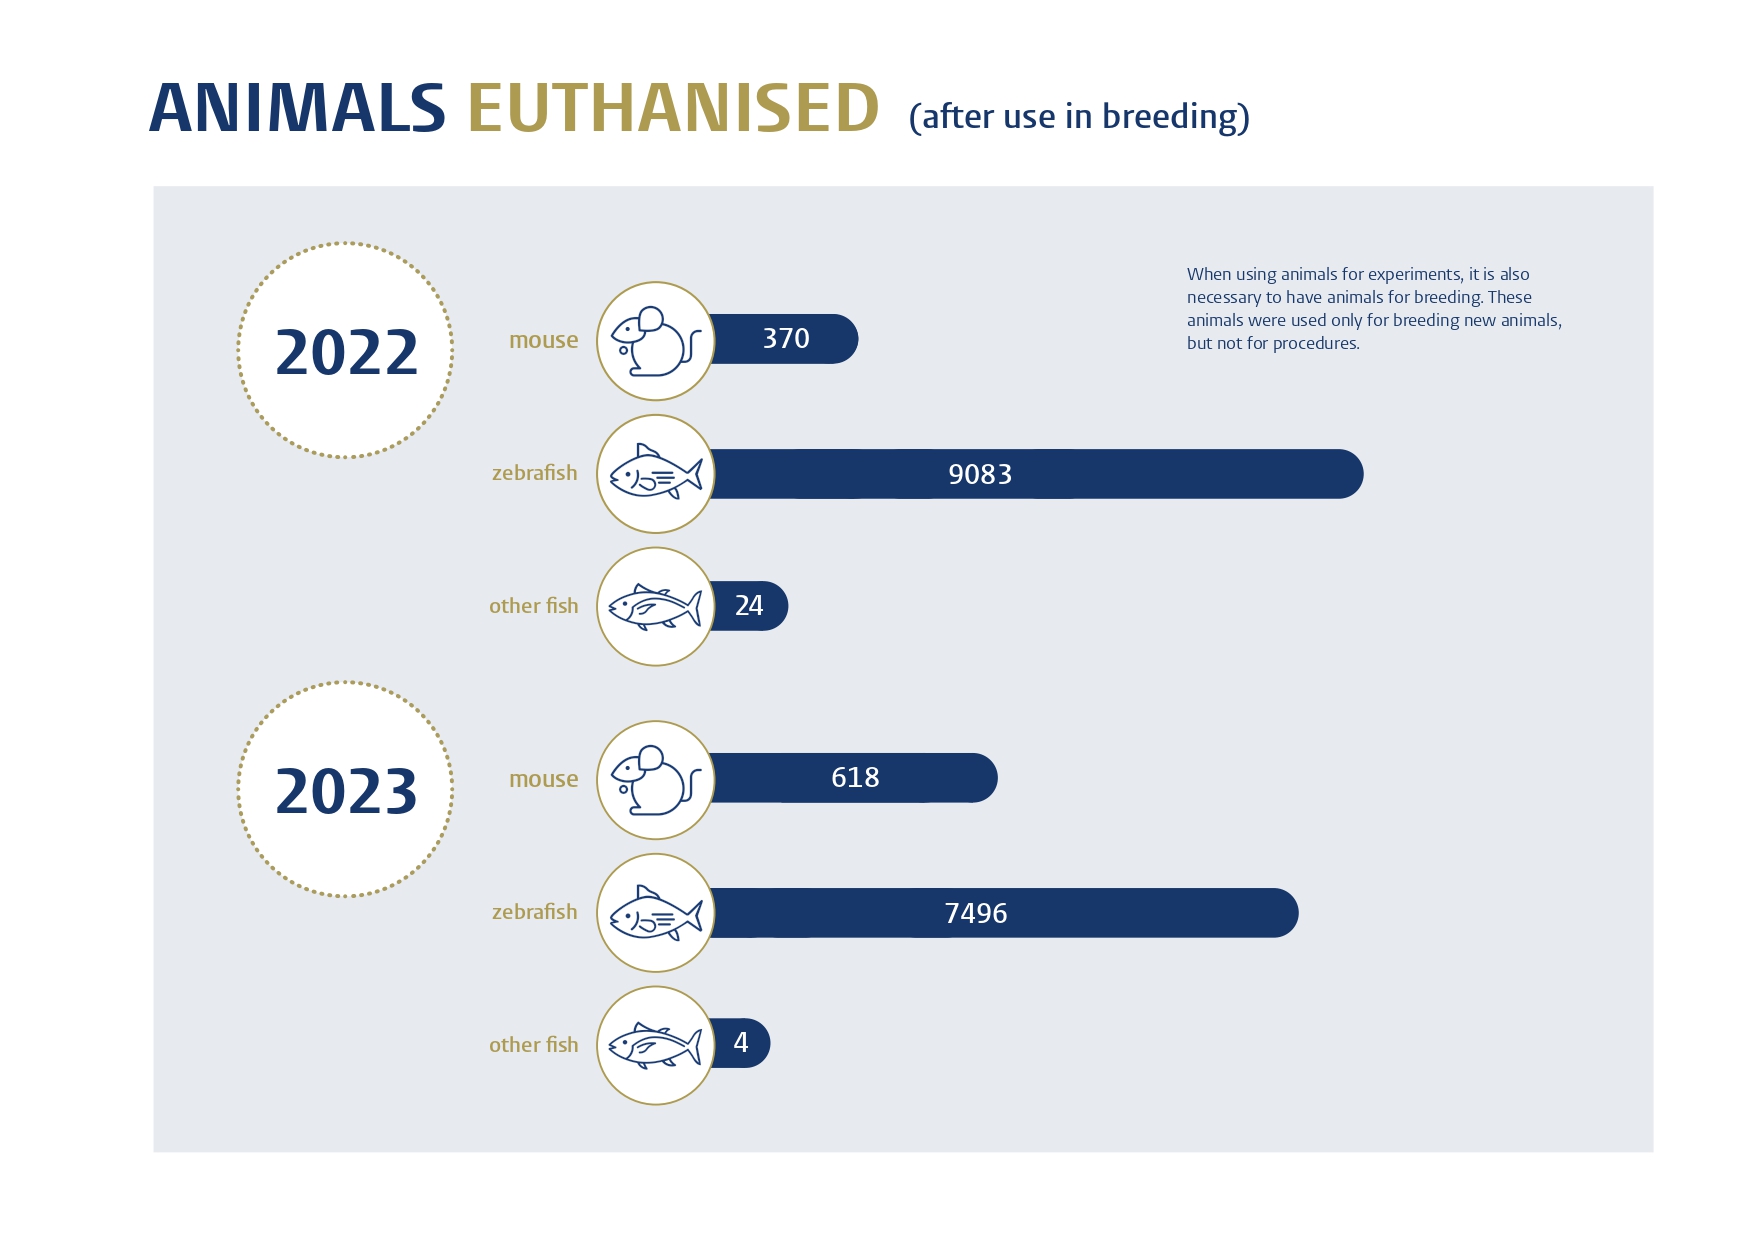
Animals that have been necessary for breeding new animals (parent animals). These animals are also classified as laboratory animals, but are euthanised after the breeding process -
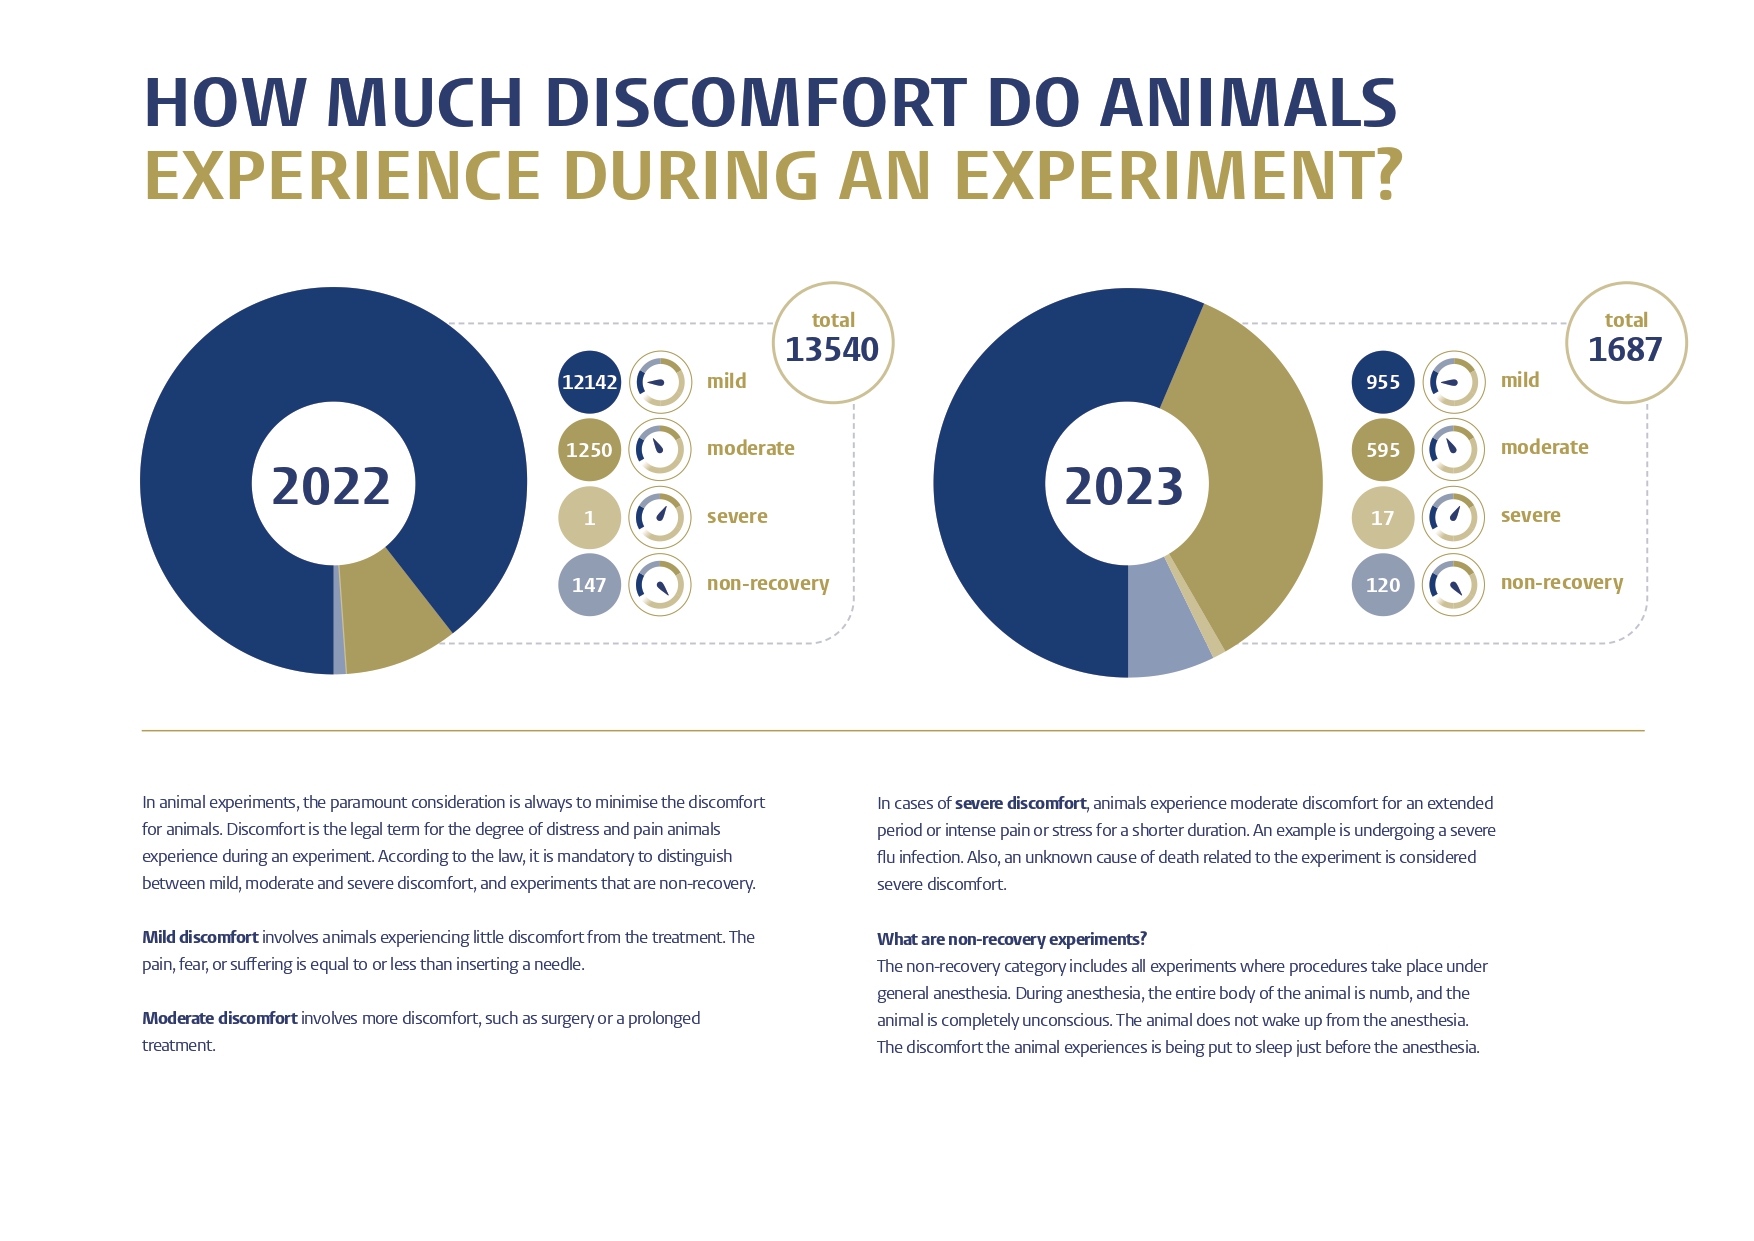
How much discomfort do animals experience during an animal experiment?
Previous years
Annual reports
- Infographic Animal Experimental Annual Report Leiden University 2021-2022
- Infographic Animal Experimental Annual Report Leiden University 2020-2021 (in Dutch)
- Animal Experimental Annual Report Leiden University 2019 (in Dutch)
- Animal Experimental Annual Report Leiden University 2018 (in Dutch)
- Animal Experimental Annual Report Leiden University 2017 (in Dutch)
- Animal Experimental Annual Report Leiden University 2016 (in Dutch)
- Animal Experimental Annual Report Leiden University 2014 (in Dutch)
Raw data
Here, you can find the raw data of the laboratory animals and experiments that we annually submit to the Dutch Food and Consumer Product Safety Authority (NVWA). The NVWA processes this data in their annual publication ‘Zo doende: Jaaroverzicht dierproeven en proefdieren Zo doende | Dierproeven voor onderzoek | NVWA’ (in Dutch).

